|
|
 发表于 2014-10-28 15:11:25
|
显示全部楼层
发表于 2014-10-28 15:11:25
|
显示全部楼层
Early-stage results from the Mapping Cancer Markers team
By: The Mapping Cancer Markers research team
27 十月 2014
摘要
Thanks to your help, the Mapping Cancer Markers team is nearly finished with benchmarking their first set of genetic markers. In this update, the team presents an in-depth review of what they've accomplished thus far, and what significance this early work will have for cancer research at their lab and elsewhere.
The Mapping Cancer Markers (MCM) team would like to extend a huge thank you to World Community Grid members everywhere. As of October 27, 2014, we have surpassed 89,000 years of computation, a goal that simply would not be possible without your help.
We are happy to report that we have begun to analyze the results using a high-throughput analytics package to assess the fitness and landscape of gene signature sizes between 5 and 25 genes. This analysis has shown that smaller signatures usually comprise different genes compared to larger signatures (i.e., you cannot "build" a larger signature from small ones), and that those genes are targeting many different signaling cascades and biological processes.
Analytics
To get a better understanding of how much data our team is receiving, we'd like to briefly introduce one of the tools that we have adopted to analyze the incoming results. From the very beginning of the project, it was clear that analyzing such a large, ongoing flow of data would be a challenge. Thus, we started to use the IBM® InfoSphere® Streams real-time analytics platform to streamline the analysis pipeline. When complete, our Streams application will run continuously, processing members' work units in real time as we receive them. We currently have the core analysis framework implemented and running on a subset of the MCM results. We will continue to add additional layers of analysis, and fine-tune our system until it is running at full capacity. For that reason, we have dedicated one of our main compute servers (IBM Power® 780) to analyzing MCM results.
Results
Pictured below is a sampling (a very small fraction) of some of the ongoing work that will establish a benchmark for further experiments. Each dot in both of the graphs is a potential lung-cancer biomarker. These graphics are distilled from thousands of MCM results sent back by World Community Grid members.
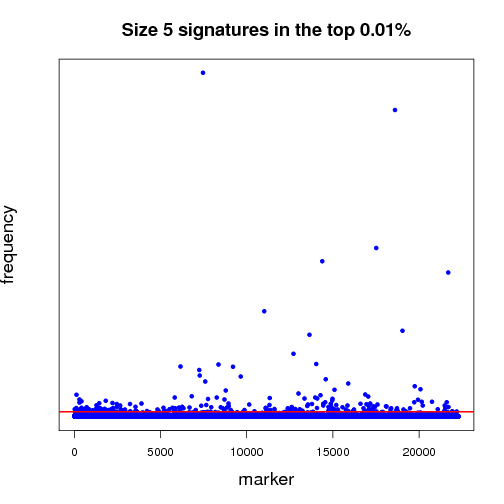
图1
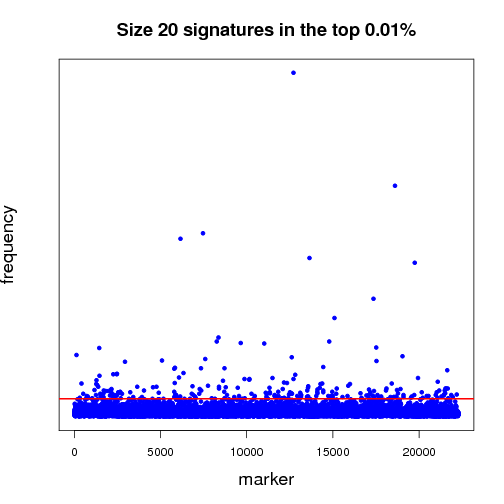
图2
Most of the dots have very little significance; this is expected because not everything shuts down or is activated in cancer. In other words, the graphics show differences between the disease state and the non-disease state, so we expect some things to be different, but not everything. For those reasons, most biomarkers cannot significantly differentiate cancer from non-cancer samples - this is represented by the haze of dots along the zero line. We show two graphs to illustrate the difference between shorter and longer gene signatures. Some genes that are more predictive in the shorter signature sizes do not necessarily hold their predictive power when considering more genes per signature. Most importantly, in each analysis, a few biomarkers frequently appear in high-scoring signatures. Our analysis wades through massive amounts of data to recognize those few markers that stand out.
The first half of the “benchmarking” experiment involves determining the performance of markers as the size of the signature changes. For instance, when we compare successful 5-marker signatures against 20-marker signatures, which markers are consistently useful? Which ones increase or diminish in predictive power? Is there an optimum size for signatures? And most importantly, can we identify seemingly minor players that are critical, but not yet in clinical use that can discriminate between normal and disease states?
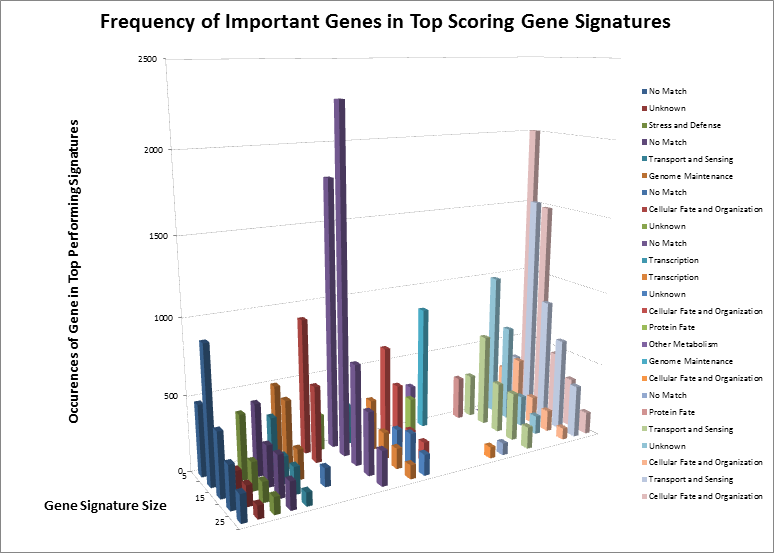
图3
After surveying the first several billion signatures, we have identified the highest-ranking combinations and underlying single genes. After separating those genes by signature size, we can see how some genes remain important regardless of the size, and how other genes “appear” to be important but are only showing up as single events. Considering we have not yet analyzed the complete data set, we have identified the genes by their known functions rather than names, to eliminate any bias towards known markers. However, even by their functions, we can see that many important signaling cascades and biological processes are affected. The most notable of these is “Cellular Fate and Organization”, which makes sense. Sometimes, when an organism loses the ability to naturally kill defective cells, it leads to uncontrolled growth, one of the hallmarks of cancer.
Network Analysis of Major Genes:
To further analyze the nature of our top-performing genes, we can identify their inter-relations in biological networks. We currently maintain one of the largest curated protein-protein interaction databases, which enables us to determine whether our genes (when converted to proteins) are known to interact with other important biomarkers, and in turn, what biological processes may be involved. The graph below shows one such network; nodes in the graph represent genes, edges are physical protein interactions. Node color highlights biological function as described in the legend. Use of biological networks can reveal very small subtleties of how the mechanisms of disease function and elucidate how our proteins may be causing problems; thus, eventually leading to understanding how cancer starts, progresses and how can we treat it.
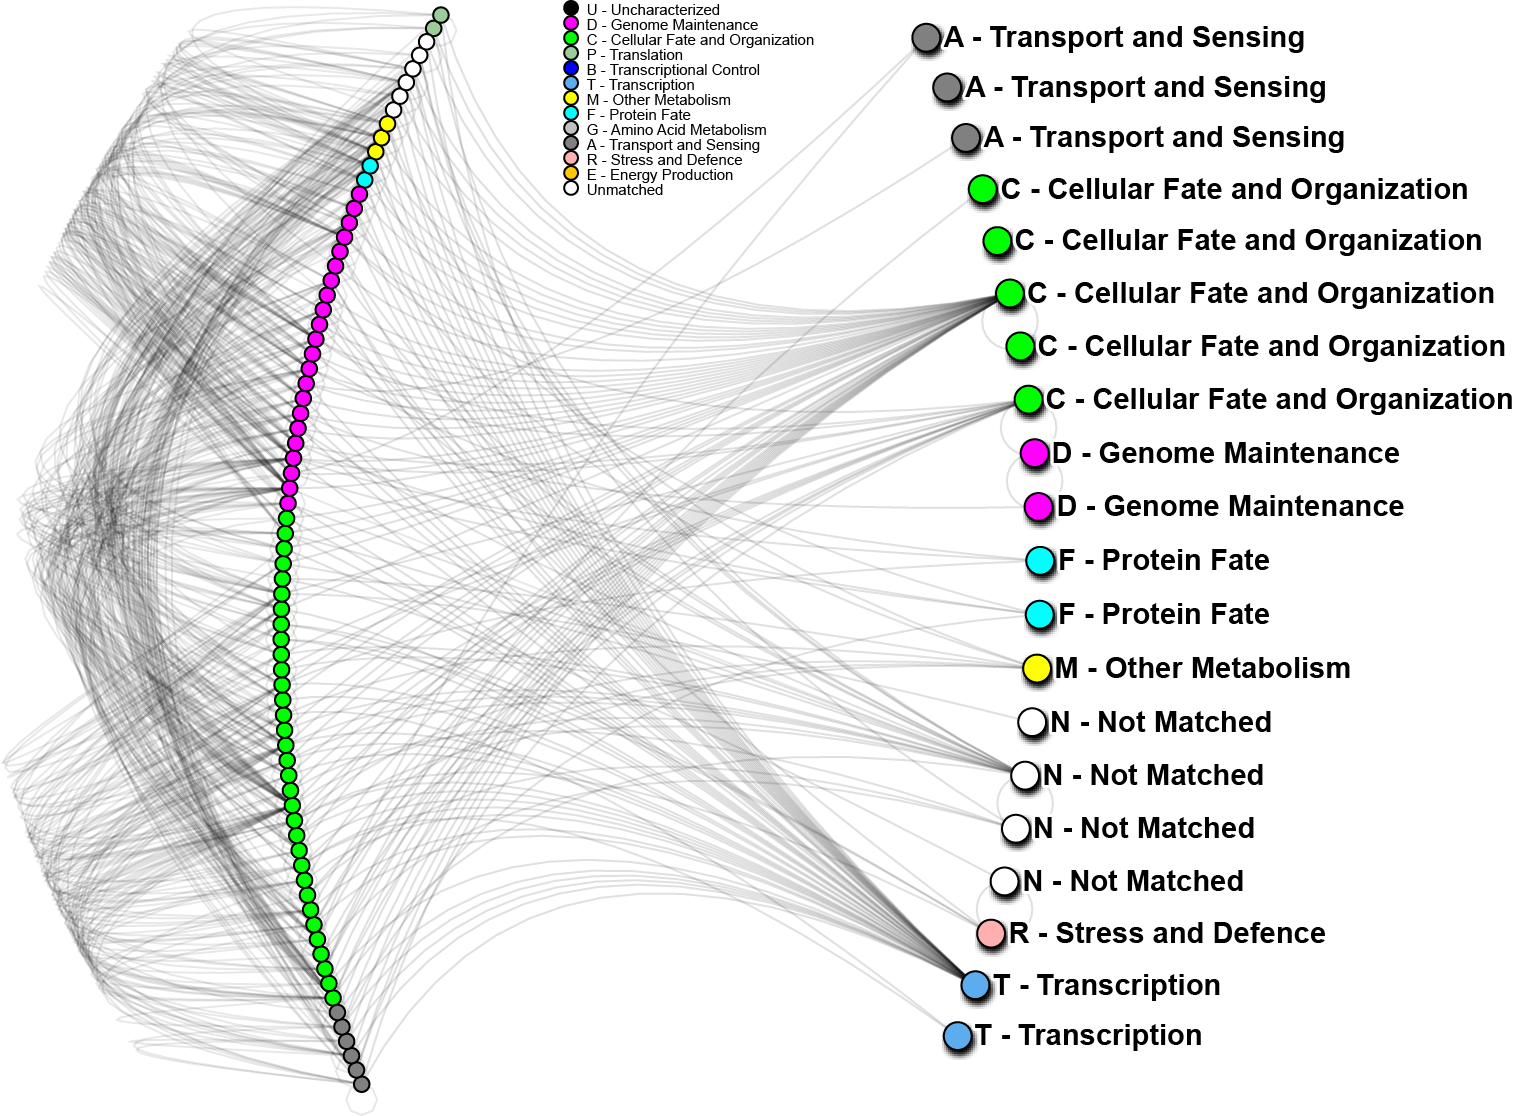
图4
In the above network, 20 out of 24 important proteins we have identified on World Community Grid (right hand side) can be linked through known protein interactions and 56 other proteins (left hand side). We have also conducted a short analysis of the 4 proteins not yet identified using a software prediction package and found those to have significant partners. Those interactions will be evaluated in the near future. The 20 proteins noted above, strikingly, do not interact directly, however, 4 of them show very high interactivity, and can be considered as hubs. From other analyses we know that “hub proteins” are often critical, as they affect many signaling cascades and biological processes. When such proteins malfunction, catastrophic changes often result. On the other hand, proteins with low interactivity could be useful as clinical biomarkers. If they are known to only interact with a few other proteins, then their activity may help to identify particular states of cancer, while having less background “noise”. As a whole we can see that for the most part, our genes of interest are targeting mostly “genome maintenance” and “cellular fate and organization” proteins, which make up about 70% of the interacting proteins (left hand side). This is a good indication that most of the pathways affected are in those major categories, which is consistent with how we understand lung cancer to progress.
Funding & Fundraising:
This past August, we completed our 4th successful Team Ian Ride for Cancer Informatics Research. We were able to raise over $80,000 for cancer research in the name of a former Jurisica student, Ian Van Toch.
Part of this funding is used for the best student paper award at the ISMB conference, and for supporting Cancer Informatics interns.
We also support a special seminar series at Princess Margaret Cancer Center, and the recent presentation by Dr. Wan Lam from BC Cancer Agency discussed “Multi-dimensional Analysis of Lung Cancer Genomes”.
大意:
MCM的早期结果
在大家的齐心协力下,第一组基因标记已经快算完了。截止10月27日,我们已经完成了8.9万年的计算。
当前我们已经开始了结果的初步分析工作。图1、2就是利用一小部分结果做出的分析图,每一个点都代表一个潜在的肺癌分子标记。目前我们仍在在对结果分析程序进行优化。
大部分标记都不明显(零轴附近),而且基因标记越少,有效性越大,我们需要慢慢统计分析数据,找出最有效的标记。
上半场的海选分析工作,主要集中于:找出有效性和分子标记数量的关联性(比如:5个标记一组和20个标记一组,结果有效性差异如何?)是否存在最佳的标记数量?
在海选结束后,下半场我们会精选最佳标记。寻找基因和生理功能的联系。有些基因的异常会导致细胞增生、无法被杀灭,而这是癌细胞最大的特点。
最终我们将把基因、蛋白质、以及蛋白质间的相互关系找出来,并将他们存档入库,以便其他人使用。如图4,左手边是我们已经研究了的20个蛋白质,后面是其他与它们有关联的56个蛋白质,另外我们还分析了4个新蛋白质。前面提到的20个蛋白质并不都是直接相互作用。其中有4个起了关键作用,一旦他们出了问题,往往会导致严重的后果。但是对我们而言,我们更关注关联性较小的蛋白质,因为他们往往只存在于特定癌细胞(肺癌)的蛋白质关联作用中,是最佳的标记,很少会出现偏差(误诊)。
译注:刚翻译完MCM的长文,超累。
下面是几篇有关新项目(Uncovering Genome Mysteries)的媒体软文,内容大同小异,我就不翻译了,鸟语好的自己去看吧。
2014 十月 27 – Crowdsourced power to solve microbe mysteries
University of New South Wales press release about the new Uncovering Genome Mysteries project on World Community Grid.
2014 十月 27 – Join in the Discovery of Nature's Hidden Superpowers
Lead researchers, Wim Degrave and Torsen Thomas, give us an insight on the new World Community Grid project, Uncovering Genome Mysteries, in this Citizen IBM blog post.
2014 十月 27 – Sydney Scientists Are Linking Home Computers Around The World To Create A Huge Super Processor
An article on Business Insider-Australia about the new Uncovering Genome Mysteries project on World Community Grid.
2014 十月 27 – Community Grid Fosters Microbial Discovery
An article published on HPC wire about the new Uncovering Genome Mysteries project on World Community Grid. |
评分
-
查看全部评分
|


 发表于 2014-10-23 12:08:13


 发表于 2014-11-11 23:30:41