“Feature - A new age for the oldest science”的版本间差异
小 |
|||
| 第44行: | 第44行: | ||
—Exerpted from an original article by Iain Coleman, which appeared in the National e-Science Newsletter to introduce the e-Science Institute Research Theme:"Next Generation Sky Surveys: Astronomical Opportunities and Computational Challenges.” Edited for iSGTW by Seth Bell. | —Exerpted from an original article by Iain Coleman, which appeared in the National e-Science Newsletter to introduce the e-Science Institute Research Theme:"Next Generation Sky Surveys: Astronomical Opportunities and Computational Challenges.” Edited for iSGTW by Seth Bell. | ||
| − | + | [[Category:文献翻译]] | |
2010年8月3日 (二) 20:56的版本
Feature - A new age for the oldest science
< 资料来源:iSGTW Astronomy issue >
Posted: 7 October 2009

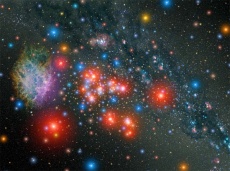
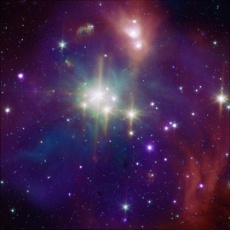
Image: NASA/courtesy nasaimages.org
For millennia, astronomy meant looking at the night sky and sketching what you saw, making star maps by estimating the relative brightnesses of stars by eye and the routes of wandering planets traced against the celestial sphere.
Even the advent of the telescope didn’t change this much. Sure, astronomers could see fainter objects like the Galilean moons of Jupiter, and resolve point-like planets into disks with structures of color and shade. But the human visual system remained an integral component, limiting data gathering to what could be seen and sketched by human observers in real time.
The advent of the photographic plate caused a revolution. Photography allowed more precise and objective measurements of objects in the sky, and long exposures could reveal fainter and more distant objects. But extracting data still involved human effort, from developing the photographic plates to reducing data into a standard format.
In recent years, all the mucking about in darkrooms has been superseded by digital photography, leading to a huge change in the practice of astronomy. Digital astronomy began as a host of small programs targeting a few individual objects. The data, manually reduced, would typically end up in the astronomer’s desk drawer. But as digital detectors became larger and cheaper they gave birth to a new kind of astronomy: Fewer surveys, but on a much larger scale, mapping vast areas of the sky at a time. Data reduction is automatic and ends up in query-able databases that astronomers worldwide can use.
Cold nights in the dome have been replaced by the warm glow of the computer screen.
These changes, driven by policy, economics and technology, are the subject of the new UK e-Science Institute research theme, “Next Generation Sky Surveys: Astronomical Opportunities and Computational Challenges.” The Theme Leader, Bob Mann, outlined the goals and ambitions of the theme to come in an eSI public lecture on 7 July.
Entering a bright new age
How much data would surveying the whole sky generate? Well, the atmospheric interference that makes stars seem to twinkle limits the resolution you can observe from ground-based telescopes to about half an arcsecond, or just over one ten-thousandth of a degree. (To give a sense of size, the moon is about 1800 arcseconds across, says The Planetary Society.) Dividing the whole area of the sky by half an arcsecond, and allowing 2-to-4 bytes per pixel to give an acceptable dynamic range for measurements, puts the size of a whole-sky survey at roughly 20 terabytes.
In the old days of photographic plates, producing 20 terabytes might take 60 years of observing time, and another ten years of digitization. Current digital sky surveys can produce 20 terabytes in a year. The newest generation of sky surveys will produce 20 terabytes every night for a decade. As data volumes increase dramatically, the importance of computation increases.
Because survey science is statistical in nature, trying to characterize populations by parameters such as the clustering of galaxies or the types of stars requires a large sample volume of the cosmos to produce meaningful results. Users must analyze data sets that are too large to practically download, so data analysis code must be run at data centers.
A further challenge is in real-time follow-up studies of transient events. When a star explodes, for example, telescopes can promptly swing round to examine the explosion at different wavelengths, revealing a wealth of scientific information — but only if they’re told in time. If a sky survey is to be able to issue an alert within one minute of detecting such a transient effect, its data reduction system needs to achieve a data rate of about 2 terabytes per hour.
So astronomers need to work with computing scientists. But is the reverse true?
Astronomical data can be very useful to computing scientists who want to develop data-handling and mining algorithms. The data has no commercial value and doesn’t refer to human beings, so there are no issues of commercial confidentiality or personal privacy.
And there is an awful lot of it.
Therefore, computational astronomy is an excellent sandbox for data-mining algorithms, and an effective way to teach both astronomy and computer science. Consequently, the new generation of sky surveys will encourage the development of new computational techniques.
The oldest science is entering a bright new age.
—Exerpted from an original article by Iain Coleman, which appeared in the National e-Science Newsletter to introduce the e-Science Institute Research Theme:"Next Generation Sky Surveys: Astronomical Opportunities and Computational Challenges.” Edited for iSGTW by Seth Bell.
