holyphoenix
资深会员

注册日期: Aug 2002
来自: 湖南
发帖数: 742 |
 SETI@home 科学通讯 #3 SETI@home 科学通讯 #3
通讯 #3
2000年6月19日
不可解释的尖峰信号?
作者:Eric Heien
翻译:holyphoenix ([email protected])
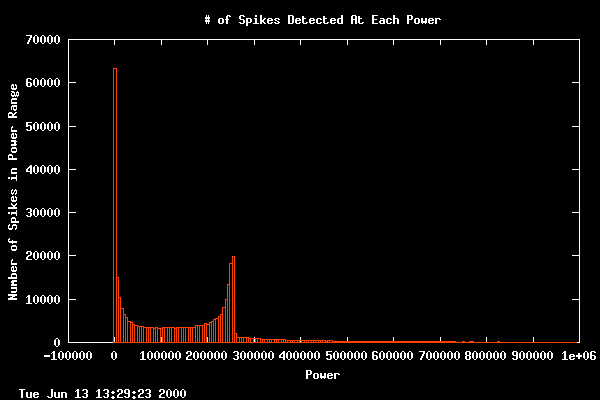
在收到成千上万热心的SETI@home用户返回的结果后,我们已经开始分析这些结果,以寻找地外文明信号的迹象。很多项分析包括简单的校准测试,这些测试用来确保数据是有效的和具有科学意义。但是,其中一种校准分析产生了一个相当令人感兴趣的结果。我们从接收自用户的5千万个尖峰信号中取样,并且据此画出曲线图,显示每个能量段尖峰信号的数量。这些图显示如下,分别采用的是标准比例和对数比例(Y轴的值增长得更快一些)。


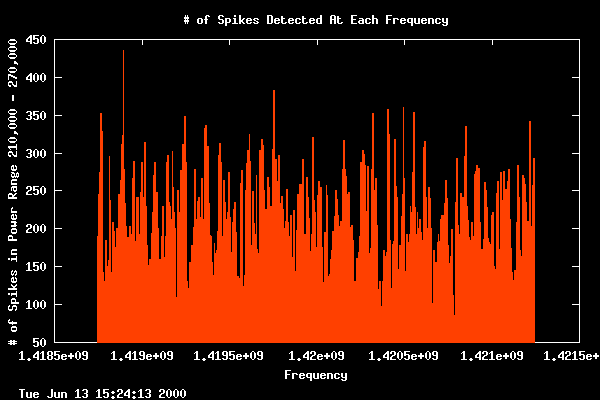
两幅图显示一个在能量值为240,000附近的、奇怪的角状尖峰信号,暗示出在这个能量段附近有额外的射电频率干扰。这和我们所预期的相反,因为根据理论能量值越高尖峰信号的数目就会越少。但是(//however,对于这个单词的翻译我一直都掌握不好,希望大家指教!),这个角不能很好地由射电频率干扰来解释,因为看上去在稍低一点能量的地方有大量的尖峰信号,但大致在能量值为265,000的地方开始分界信号数目急剧减少(//but virtually none past a cutoff power of roughly 265,000)。为了尝试确定这些尖峰信号的类型(//nature),我们调查了在这个“角”中那些频率段贡献了最多的尖峰信号。

再一次,看上去我们所发现的这个奇怪的“角”仍然没有解释。射电频率干扰的标准辐射源,像雷达或者过顶的卫星,通常倾向于在一个非常小的频率范围中辐射出非常高能量的信号(// would tend to emit the high powered transmissions over a very small frequency range)。就向上图所显示的,在这个尖峰信号之角(//spike horn)和任何特定频率之间没有什么有意义的联系。虽然一颗广谱卫星能够辐射如此宽的频率范围以引起像上图所显示的干扰,但是一颗单独的卫星是不可能在Arecibo上空停留如此之久,并导致了如我们所发现的那样的如此之多的尖峰信号。

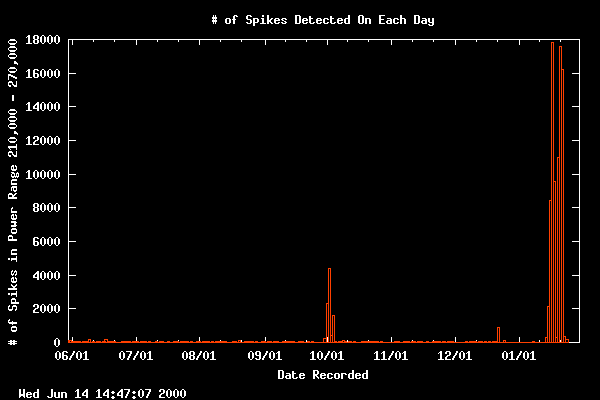
最后,从一副尖峰信号来源的日期图,我们得到了答案。这一部分的尖峰信号大部分来自于2000年1月17日到21日。这几天中,Arecibo望远镜暂时的损坏了。
万维网网址:http://setiathome.ssl.berkeley.edu/index.html
版权所有:Copyright ©2001 SETI@home
// 原文网址:http://setiathome.ssl.berkeley.edu/...ewsletter3.html
// 欢迎大家对我的翻译批评指正!!!
// 我在译文中用(//)表示的就是我所拿不准如何翻译的部分。
// 同时希望大家能对其他译文指教!
附原文
Newsletter #3
June 19, 2000
Unexplainable Spikes?
Eric Heien
After having received so many results from the hundreds of thousands of enthusiastic users of SETI@home, we have begun analyzing these results for signs of an extraterrestrial signal. Many of these analyses include simple calibration tests to ensure that the data are valid and make sense scientifically. One of these calibration analyses, however, yielded a rather interesting result. We took a sample of 50 million spikes received from users, and plotted these, displaying the number of spikes at each power. The graphs displaying the results of this plot are below, plotted both on a standard scale and a log scale (in which the y-axis values grow increasing larger).
Both graphs display an odd hornlike spike at around power 240,000, implying an excess of radio frequency interference around that power. This goes against what we expect, since in theory there would be fewer spikes at greater powers. The horn could not be explained very well by radio frequency interference, however, since it seems to have a great deal of spikes at slightly lower powers, but virtually none past a cutoff power of roughly 265,000. In an attempt to determine the nature of these spikes, we investigated which frequencies contributed most to the spikes within the "horn".
Again, there seemed to be no explanation for the strange spike "horn" we had found. A standard emitter of radio frequency interference, such as a radar or satellite passing overhead, would tend to emit the high powered transmissions over a very small frequency range. As shown by the graph above, there was no significant correlation between the spike horn and any particular frequency, which ruled out much of the standard radio frequency interference. Although it is possible that a spread-spectrum satellite emitting over a wide frequency range could cause interference like this, a single satellite would not be over Arecibo long enough to result in as many spikes as were found.
Finally, a display of the days the spikes originated from yielded the answer. The vast majority of the spikes were coming from January 17th-21st, 2000. It turns out that on these days, the Arecibo telescope receiver was temporarily broken.
http://setiathome.ssl.berkeley.edu/index.html
Copyright ©2001 SETI@home
__________________
Are We Alone?
向版主反映这个帖子 | IP: 已记录
|


